
Big Cap Alpha – Signal Table Explanation
These are explanations to each section of the signals page. If something does not make sense, either email us or add a comment below.
Signals Table
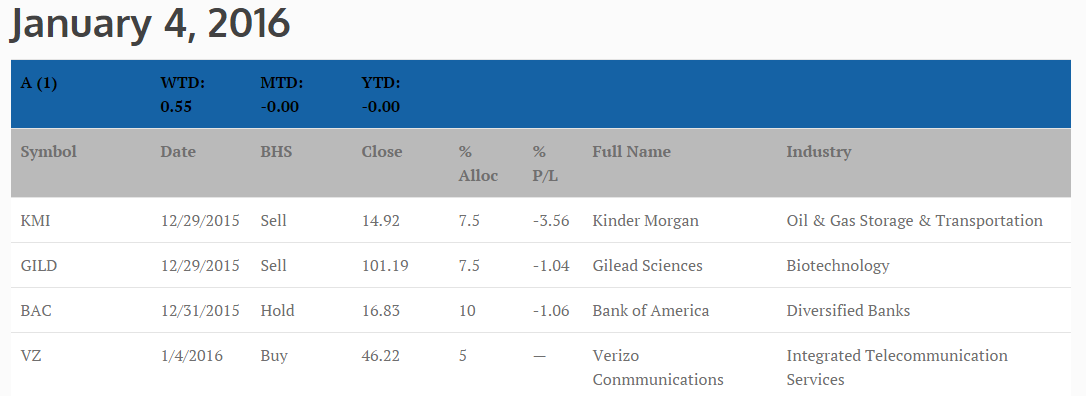
Date Line: The date the signals are for
Top Blue Line: The name of the portfolio. The number in parentheses is the portfolio number.
WTD: The current week’s return. This includes open and closed positions.
MTD: The current month-to-date return of the portfolio. This includes open and closed positions.
YTD: The current -year-to-date return of the portfolio. This includes open and closed positions.
The MTD and YTD returns may not match results derived from the signals in the tables. MTD and YTD are calculated by running a backtest on the current historical data. This data may have changed slightly due to price corrections, dividends and other reasons.
This table contains the current positions for the portfolio.
Symbol: The symbol of the stock
Date: The date that the stock was entered on
BHS: Tells if the stock is a BUY or HOLD or SELL.
Close: The last closing price of the stock
% Alloc: The percentage of the portfolio to allocate to this position
% P/L: The percent profit or loss of the position at the close
Full Name: The full name of the stock
Industry: The industry the stock belongs to
Questions? Email us.
[…] Signal Table Explanation […]
[…] Signal Table Explanation […]