Own the Strongest Stocks in the Market’s Strongest Sectors
A professional quantitative trend-following strategy that combines sector rotation, relative strength, and institutional momentum to identify tomorrow’s market leaders.
Every evening Sector Comets scans more than 3,000 stocks looking for the brightest opportunities emerging from the market’s strongest sectors.
Perfect for Experienced Traders:
Takes 5-10 minutes a night to place trades
No need to watch the market during market hours
Trades liquid Russel 3000 stocks
We’ve eliminated the emotional aspects of trading while maintaining the aggressive returns professional traders demand. This is institutional-grade strategy design meets practical implementation. .
Average annual return over 20% over the last 18 years
Can be traded a minutes a day
Multiple portfolio based strategies to choose from
Long trades only
Over 45% winners
Positive returns in most years
How Sector Comets Came to Be
The strongest stocks are rarely found in weak sectors.
Cesar used this premise to see if there was real alpha in this concept
He set out to build a completely objective system that identifies the strongest sectors early, then systematically owns only the strongest stocks inside them?
This project became Sector Comets.
Sector Comets simply follows where institutional capital is already flowing.
Large institutions don’t build billion-dollar positions in a single afternoon.
Their buying often unfolds over weeks or months, creating persistent trends that can continue far longer than most investors expect. Rather than attempting to predict which sector will become the next leader, Sector Comets measures what is actually happening in today’s market.
Each evening the system:
Ranks every major market sector by relative strength.
Identifies the strongest stocks within those leading sectors.
Filters for liquidity, momentum, and trend quality.
Generates objective entry, exit, stop-loss, and profit-target levels.
The result is a portfolio that continually adapts as leadership changes throughout the market cycle.
Start your free 7-day trial now
Only available to members of The Crew, my private trading club
Testing period is from January 1, 2008 to September 30, 2026 and metrics are updated after the end of each quarter.
Live trading signals have been published on the site since August 2026. You will have access to all entry & exit signals since then.
Portfolio 1 – Barnard
Longer holds. Gives positions time to run. Maximum stop loss of 20%. Profit target of 50%. Least aggressive market timing.
Portfolio Statistics
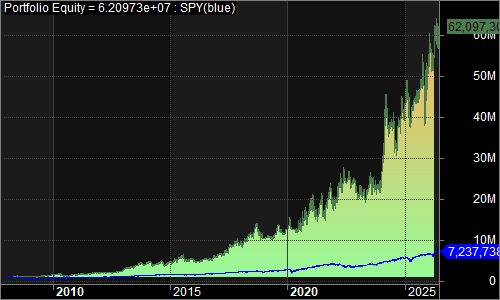
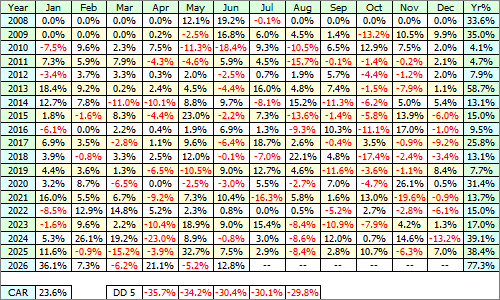
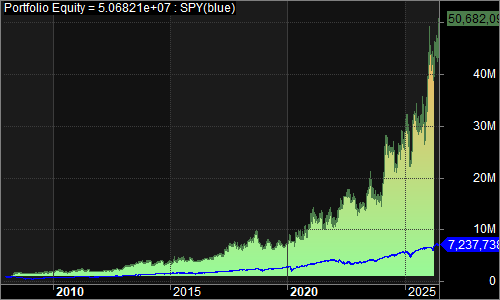
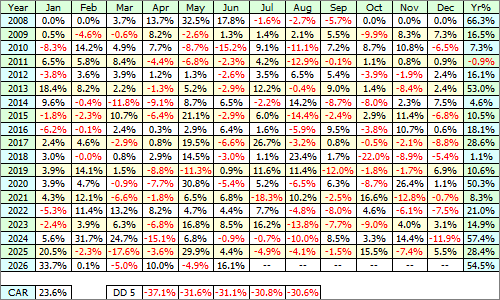
23.7% Compounded Annual Returns
86.0% Exposure
0.70 Sharpe Ratio
Top three drawdowns(-46.5, -38.9, -31.5)
-42.3% Worst 3 month return
-43.9% Worst 12 month return
+97.89% Best 3 month return
+105.132% Best 12 month return
0.32 correlation with the S&P500 index
Trades Statistics
558 Trades with 47.5% winners
22.7% Average % profit on winning trades
-11.8% Average % loss on losing trades
37 Average trading bars held
-44.0% Worst trade
86.0% Best trade
Maximum of 5 positions
20% percent of portfolio per position
Equity Curve since 2008
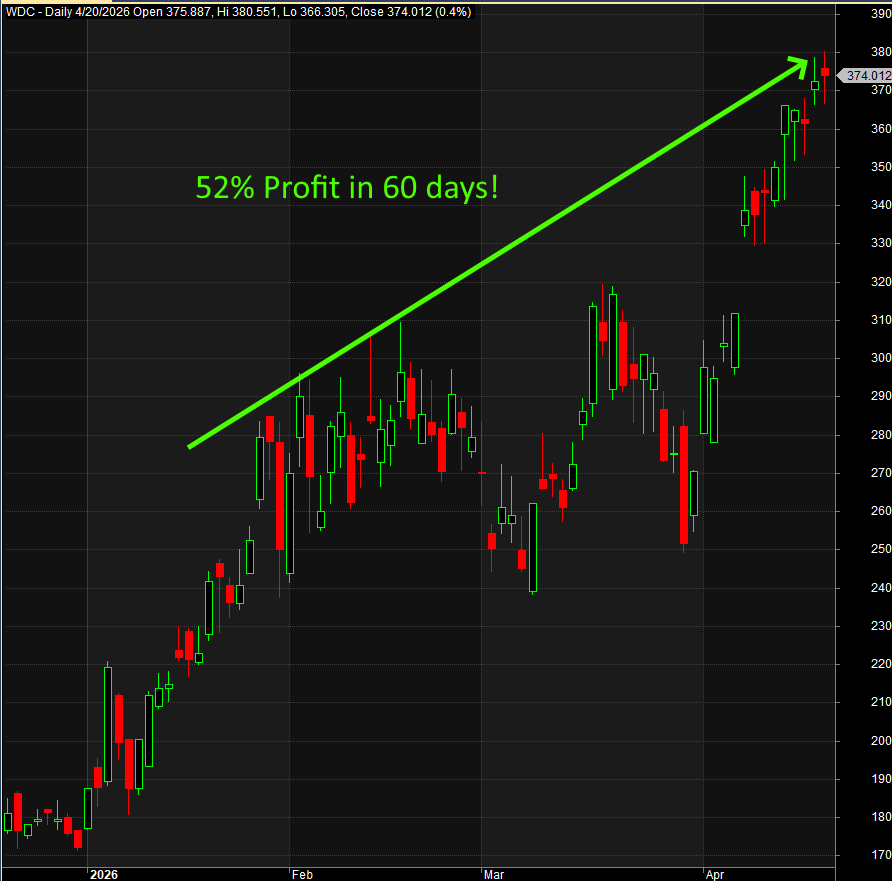
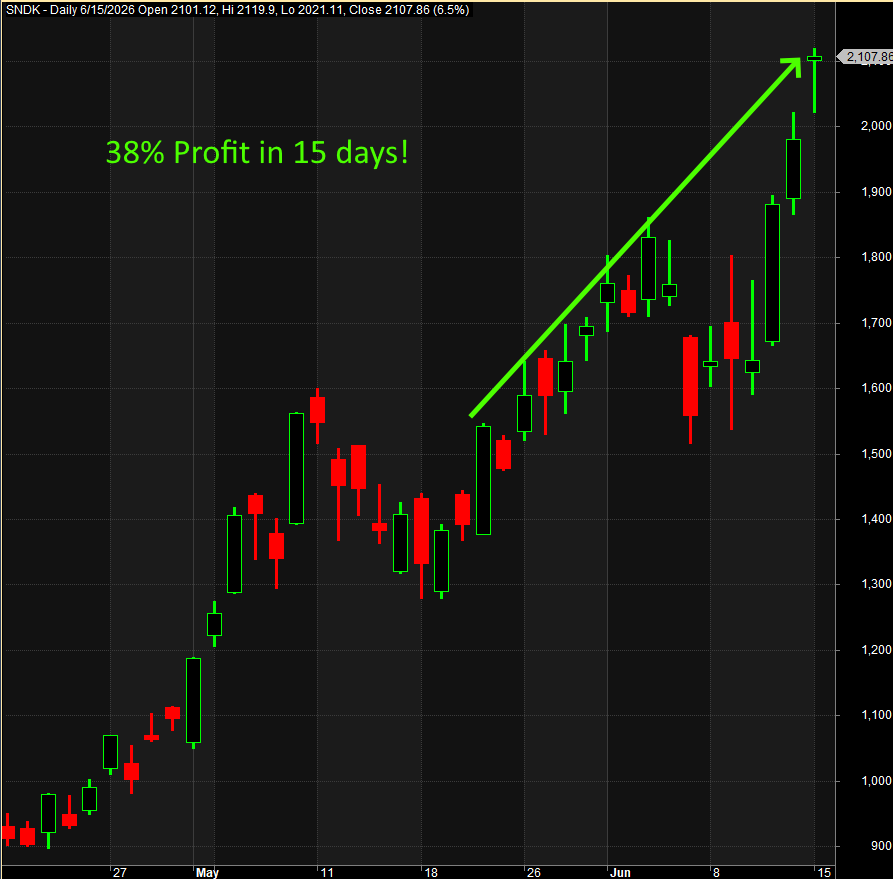
Sample Winner
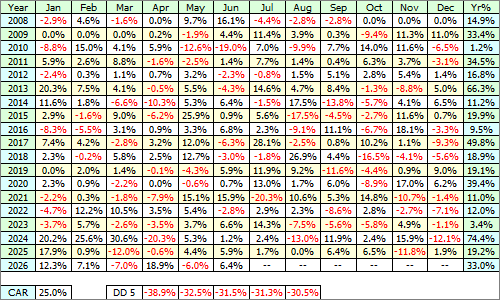
Monthly Returns
I have over a decade of quant trading experience and am the Chief Investment Officer for a quant-based advisory firm. I’ve known Cesar for 8 years and he is my first and foremost “go-to” resource for financial markets research, quantified strategy development, and coding. Unlike some theoretical “quants,” Cesar is also a trader. He understands the markets and the real-world limitations of broker order offerings, liquidity, and order placement. Rob Davenport, LCA Capital, LLC
Portfolio 2 – Herschel
A balance between Barnard and Messier. Maximum stop loss of 20%. Profit target of 40%.
Portfolio Statistics
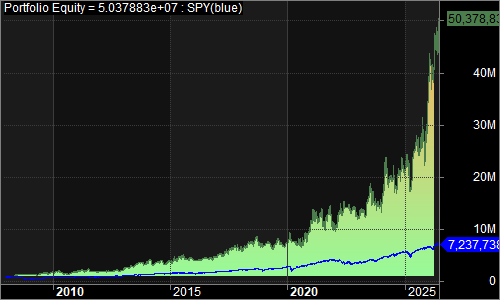
22.4% Compounded Annual Returns
82.2% Exposure
0.65 Sharpe Ratio
Top three drawdowns(-38.6, -37.0, -35.7)
-34.7% Worst 3 month return
-18.8% Worst 12 month return
+58.73% Best 3 month return
+154.178% Best 12 month return
0.31 correlation with the S&P500 index
Trades Statistics
703 Trades with 47.1% winners
20.0% Average % profit on winning trades
-11.2% Average % loss on losing trades
28 Average trading bars held
-32.2% Worst trade
76.9% Best trade
Maximum of 5 positions
20% percent of portfolio per position
Equity Curve since 2008
Sample Winner
Monthly Returns
There’s no way I’d be professionally managing money today were it not for the professional advice and help of Cesar Alvarez. I’ve yet to meet a trader/researcher with such a superb understanding of the markets; as well as the dangerous trapdoors that await if you decide to develop your own quant system. Mark Angil, Architect of Midway II, 1st Place Winner of BattleFin’s Sharpe Ratio Shootout International Quant Finance Tournament 4.0 (Pro Division)
Portfolio 3 – Messier
Shortest holds. Has closest stops and most aggressive market timing. Maximum stop loss of 20%. Profit target of 30%.
Portfolio Statistics
22.8% Compounded Annual Returns
83.4% Exposure
0.64 Sharpe Ratio
Top three drawdowns(-39.2, -37.1, -32.3)
-36.5% Worst 3 month return
-27.9% Worst 12 month return
+77.80% Best 3 month return
+92.142% Best 12 month return
0.31 correlation with the S&P500 index
Trades Statistics
863 Trades with 48.9% winners
16.7% Average % profit on winning trades
-10.5% Average % loss on losing trades
23 Average trading bars held
-43.9% Worst trade
94.5% Best trade
Maximum of 5 positions
20% percent of portfolio per position
Equity Curve since 2008
Sample Winner
Monthly Returns
Start your free one week trial
During your trial you will have access to all previous trades and commentary. Cesar or Steve are available to answer your questions.
Start your free 7-day trial
Only available to members of The Crew, my private trading club
I have been corresponding with Cesar and following his work for several years. His research is first rate and his reports are clear and unambiguous. He is an expert trading system developer and programmer. Most importantly, he has discovered profitable and persistent patterns, and developed profitable and practical trading systems around them. Dr. Howard Bandy Recognized Quant Author
The Researchers
Cesar Alvarez
Cesar is well known in the quant community from his trading blog, Alvarez Quant Trading, where he shares his trading insights and research. He also consults with traders to test their trading ideas and help them improve their current strategies. From 2004 to 2013, Cesar was the Director of Trading Strategies at TradingMarkets.com and Connors Research. Cesar has also developed many strategies for private equity funds, is the author of multiple books on trading, and — in a former life — was a Software Engineer on the early versions of Microsoft Excel. After so many years developing well over 100 different methodologies, Cesar, like many true masters of his profession, has come back to the point of ultimate simplicity and efficiency as the best sustainable approach to active trading.
Steven Gabriel
Steven has an extensive history trading equities, options, futures, and volatility. For the past 13 years he has been a quant-based trader, working alongside Cesar on research for 100’s of different ideas, concepts, strategies, and systems. Steve is also an Emergency Room physician. But he only practices medicine half-time now, because his success in trading financial markets.