Discover the algorithmic trading strategy that’s been consistently outperforming the market since 2008
Tech Torque was developed over many years with a combination of high alpha predictor variables. The result of this is a tech only strategy that concentrates into only the best of the best positions while maintaining contained drawdowns relative to the annual returns. There are three versions ranging from higher variance to lower variance based on the number of positions. In the three position version, average annual return of 24% with a lowest drawdown of 27%. It is remarkable for carrying 33% position sizing.
The strategies use predictor variables to find the best of the best, leading tech trades in optimal pullback situations set up for a bounce resulting in 67% winners with 4 day holds.
In addition, correlation with the S&P 500 index is negligible allowing Tech Torque to be added to a basket of strategies with negligible correlation to the broad market. It is extremely rare to find alpha with little correlation to the S&P itself.
Perfect for Experienced Traders:
Takes 5-10 minutes a night to place trades
No need to watch the market during market hours
Trades liquid Nasdaq stocks
We’ve eliminated the emotional aspects of trading while maintaining the aggressive returns professional traders demand. This is institutional-grade strategy design meets practical implementation.
Average annual return over 20% over the last 12 years
Can be traded a minutes a day
Multiple portfolio based strategies to choose from
Trades only Nasdaq stocks
Long trades only
Over 60% winners
Positive returns in 15 of the last 17 years
How Tech Torque Came to Be
Tech Torque has been a labor of love. I never believed that I could keep drawdowns low while trading large size and few positions. Looking back at some strategies I’ve developed over the years, I figured out a way to combine some high alpha predictive concepts all together to have extremely high filtering and extremely high quality trades which resulted in a small number of trades consistently doing well.
Using only 3 trading slots with each trade size being 33.3%, I was happily surprised to see over 20% returns with drawdowns less than 30%. I looked through all of the trades and the bottom line is that combining a few powerful high alpha mechanics that left the absolutely best trades.
The strategy is phenomenal, high return, low correlation to the S&P, and relatively low drawdown.
I tested it out of sample, varying filters, and it’s robust. As a matter of fact out of sample results were even better ( a rare, but welcome result).
Start your free 7-day trial now
Only available to members of The Crew, my private trading club
Testing period is from January 1, 2008 to December 31, 2025 and metrics are updated after the end of each quarter.
Live trading signals have been published on the site since December 2024. You will have access to all entry & exit signals since then.
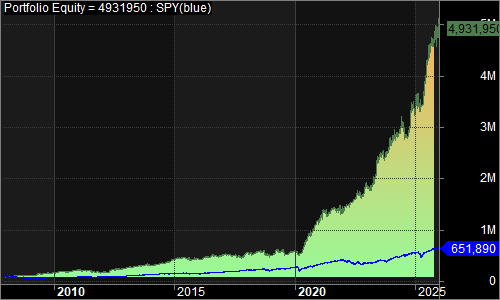
Portfolio 1 – Achernar
This portfolio is the most aggressive with a maximum of 3 positions.
Portfolio Statistics
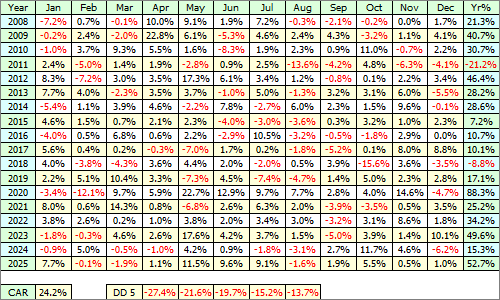
24.2% Compounded Annual Returns
59.6% Exposure
1.25 Sharpe Ratio
Top three drawdowns(-27.4, -21.6, -19.7)
-26.6% Worst 3 month return
-28.4% Worst 12 month return
+52.52% Best 3 month return
+151.151% Best 12 month return
0.37 correlation with the S&P500 index
Trades Statistics
1944 Trades with 67.5% winners
2.63% Average % profit on winning trades
-3.47% Average % loss on losing trades
4 Average trading bars held
-28.4% Worst trade
51.2% Best trade
Maximum of 3 positions
33.3% percent of portfolio per position
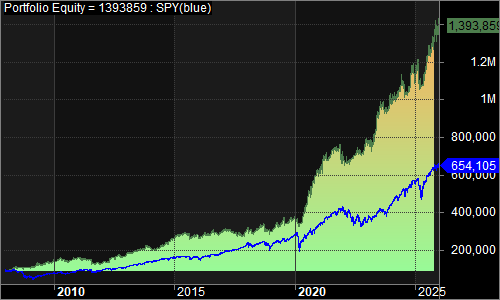
Equity Curve since 2008
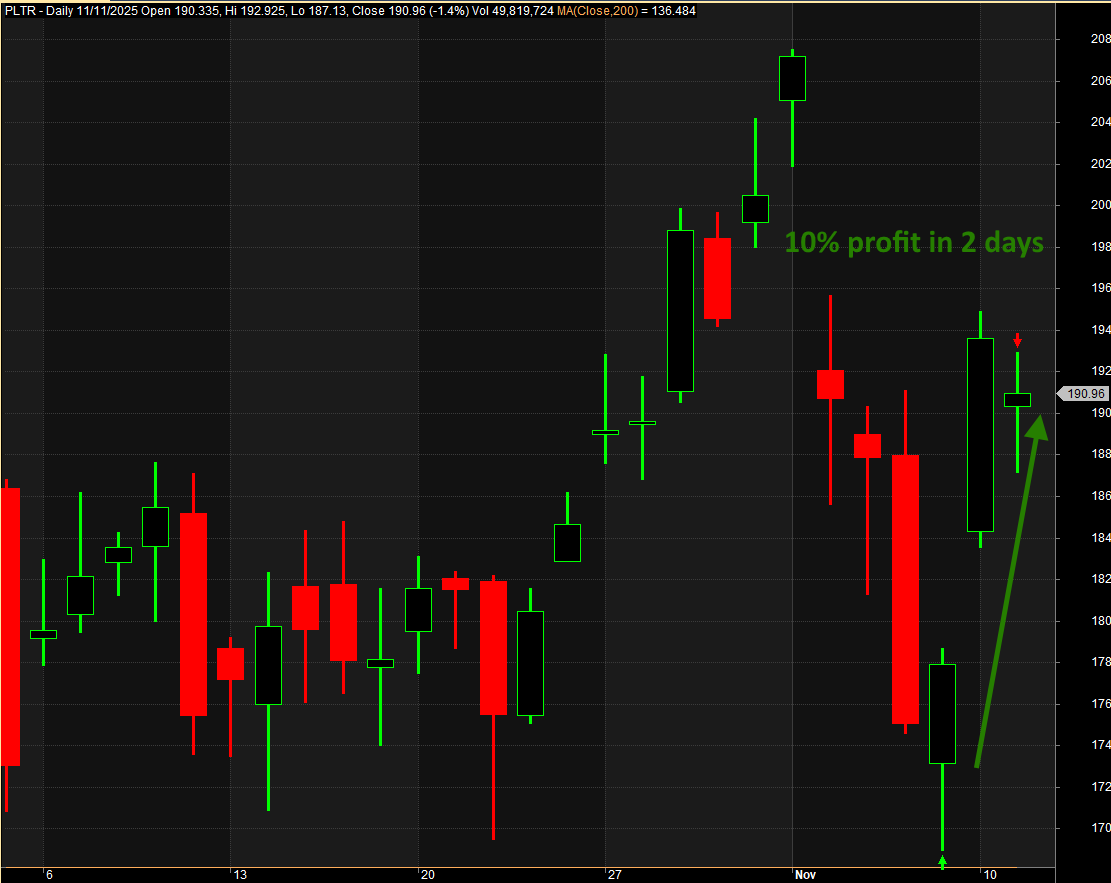
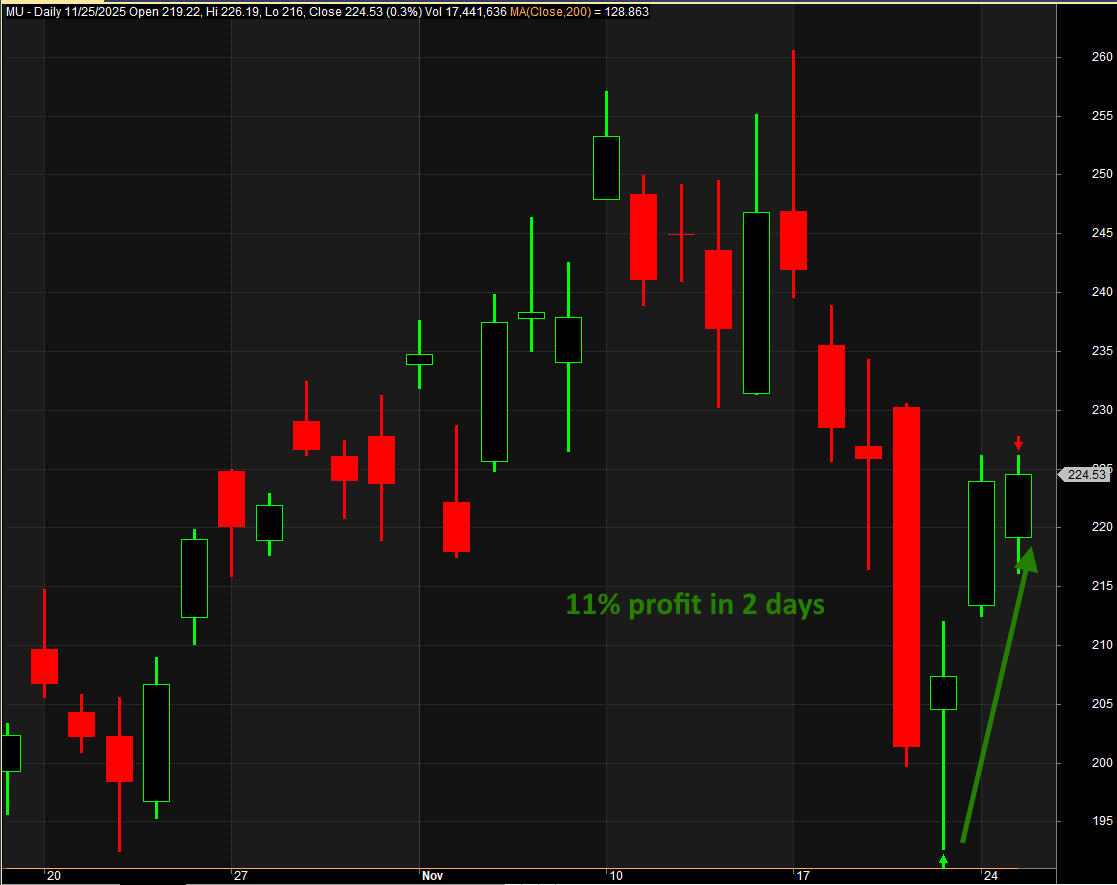
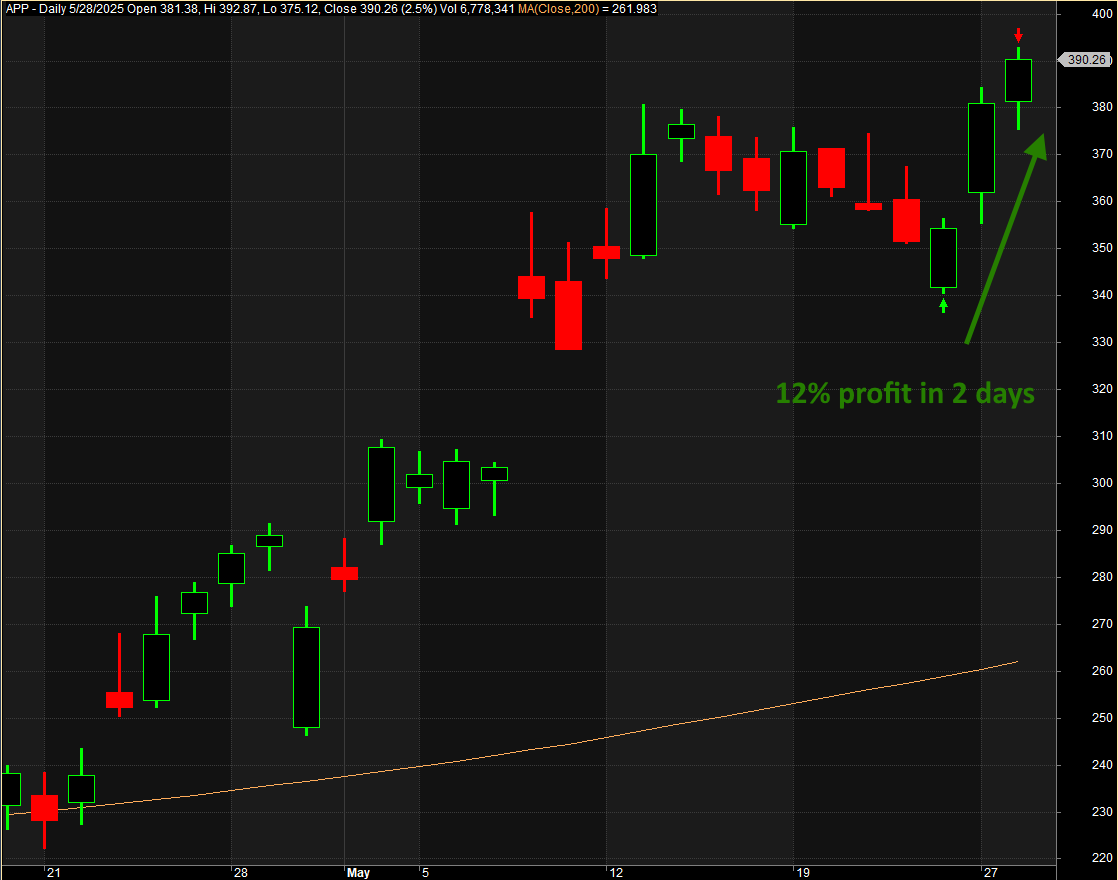
Sample Winner
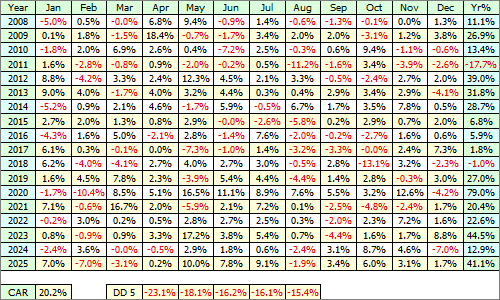
Monthly Returns
I have over a decade of quant trading experience and am the Chief Investment Officer for a quant-based advisory firm. I’ve known Cesar for 8 years and he is my first and foremost “go-to” resource for financial markets research, quantified strategy development, and coding. Unlike some theoretical “quants,” Cesar is also a trader. He understands the markets and the real-world limitations of broker order offerings, liquidity, and order placement. Rob Davenport, LCA Capital, LLC
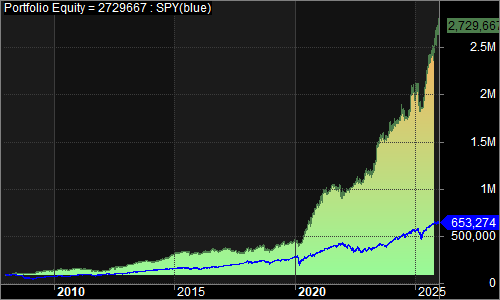
Portfolio 2 – Altair
This is version is a balance between the other two.
Portfolio Statistics
20.2% Compounded Annual Returns
56.4% Exposure
1.20 Sharpe Ratio
Top three drawdowns(-23.1, -18.1, -16.2)
-12.3% Worst 3 month return
-17.7% Worst 12 month return
+41.41% Best 3 month return
+132.133% Best 12 month return
0.39 correlation with the S&P500 index
Trades Statistics
2450 Trades with 67.4% winners
2.54% Average % profit on winning trades
-3.47% Average % loss on losing trades
4 Average trading bars held
-26.6% Worst trade
51.2% Best trade
Maximum of 4 positions
25% percent of portfolio per position
Equity Curve since 2008
Sample Winner
Monthly Returns
There’s no way I’d be professionally managing money today were it not for the professional advice and help of Cesar Alvarez. I’ve yet to meet a trader/researcher with such a superb understanding of the markets; as well as the dangerous trapdoors that await if you decide to develop your own quant system. Mark Angil, Architect of Midway II, 1st Place Winner of BattleFin’s Sharpe Ratio Shootout International Quant Finance Tournament 4.0 (Pro Division)
Portfolio 3 – Regulus
This portfolio is the least aggressive with a maximum of 5 positions.
Portfolio Statistics
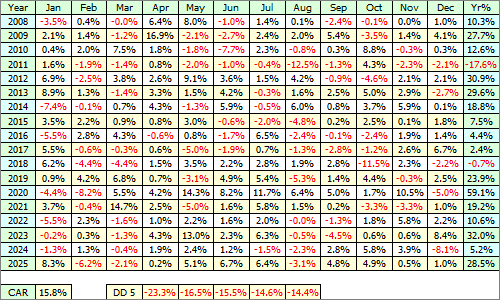
15.8% Compounded Annual Returns
53.7% Exposure
1.00 Sharpe Ratio
Top three drawdowns(-23.3, -16.5, -15.5)
-14.0% Worst 3 month return
-17.6% Worst 12 month return
+38.38% Best 3 month return
+103.104% Best 12 month return
0.41 correlation with the S&P500 index
Trades Statistics
2902 Trades with 66.8% winners
2.48% Average % profit on winning trades
-3.51% Average % loss on losing trades
4 Average trading bars held
-26.6% Worst trade
51.2% Best trade
Maximum of 5 positions
20% percent of portfolio per position
Equity Curve since 2008
Sample Winner
Monthly Returns
Start your free one week trial
During your trial you will have access to all previous trades and commentary. Cesar or Steve are available to answer your questions.
Start your free 7-day trial
Only available to members of The Crew, my private trading club
I have been corresponding with Cesar and following his work for several years. His research is first rate and his reports are clear and unambiguous. He is an expert trading system developer and programmer. Most importantly, he has discovered profitable and persistent patterns, and developed profitable and practical trading systems around them. Dr. Howard Bandy Recognized Quant Author
The Researchers
Cesar Alvarez
Cesar is well known in the quant community from his trading blog, Alvarez Quant Trading, where he shares his trading insights and research. He also consults with traders to test their trading ideas and help them improve their current strategies. From 2004 to 2013, Cesar was the Director of Trading Strategies at TradingMarkets.com and Connors Research. Cesar has also developed many strategies for private equity funds, is the author of multiple books on trading, and — in a former life — was a Software Engineer on the early versions of Microsoft Excel. After so many years developing well over 100 different methodologies, Cesar, like many true masters of his profession, has come back to the point of ultimate simplicity and efficiency as the best sustainable approach to active trading.
Steven Gabriel
Steven has an extensive history trading equities, options, futures, and volatility. For the past 13 years he has been a quant-based trader, working alongside Cesar on research for 100’s of different ideas, concepts, strategies, and systems. Steve is also an Emergency Room physician. But he only practices medicine half-time now, because his success in trading financial markets.