
Snap Dragon – Signal Table Explanation
These are explanations to each section of the signals page. If something does not make sense, either email us or add a comment below.
Signals Table
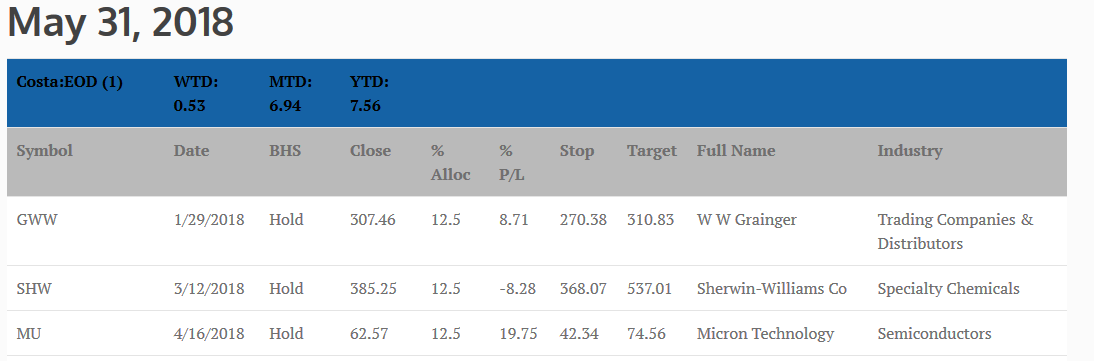
Date Line: The date the signals are for
Top Blue Line: The name of the portfolio. The number in parentheses is the portfolio number.
WTD: The current week’s return. This includes open and closed positions.
MTD: The current month-to-date return of the portfolio. This includes open and closed positions.
YTD: The current -year-to-date return of the portfolio. This includes open and closed positions.
The MTD and YTD returns may not match results derived from the signals in the tables. MTD and YTD are calculated by running a backtest on the current historical data. This data may have changed slightly due to price corrections, dividends and other reasons.
This table contains the current positions for the portfolio.
Symbol: The ticker symbol of the stock
Date: The entry date of the trade
BHS: Tells if the stock is a BUY or HOLD or SELL.
Close: The most recent closing price of the stock
% Alloc: The percentage of the portfolio to allocate to this position
% P/L: The percent profit or loss of the position as of the most recent close
Stop: This is the stop price for the stock. Each portfolio evaluates this price at different times. Make sure you understand this. Read Choosing a Portfolio and How to Place Orders.
Target: This is the target price for the stock. Each portfolio evaluates this price at different times. Make sure you understand this. Read Choosing a Portfolio and How to Place Orders.
Full Name: The full name of the stock
Industry: The industry the stock belongs to
New Postions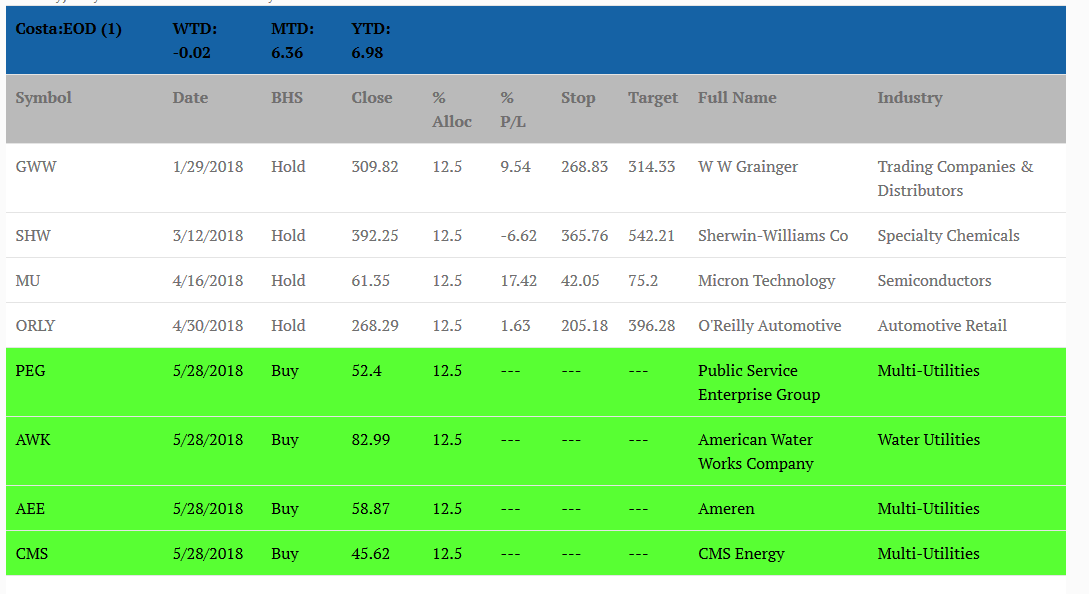
New positions will appear only on weekends for all portfolios. The lines will be green to make it easy to spot.
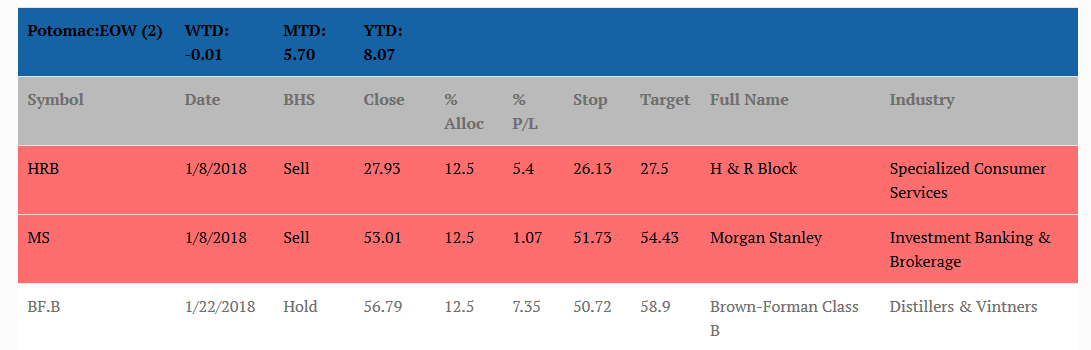
Exits
Exits will appear in red. Depending on the portfolio, they may show up differently and have different meanings.
Costa:EOD (1) – Sell can show up during any day of the week. Exit is on the next day.
Potomac:EOW (2) – Sell can show up only on weekends. Exit is on the next day.
Sonnet:Intraday (3) – Exits can either happen intraday or on the weekend because of the exit adjustments. In the weekend case, the strategy exits on the next day. For the weekend exit, the table will look like the one above.
Example of intraday exit. This is only informational since the strategy should already be out of the position.
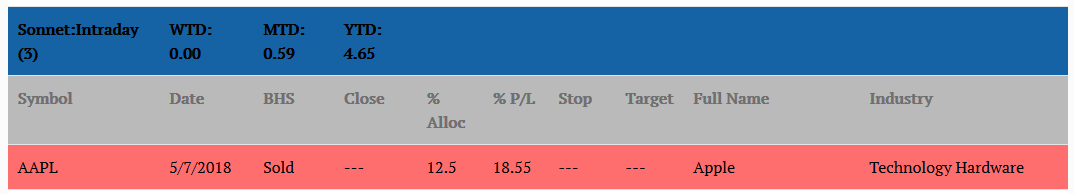
Notice how the the BHS column says ‘Sold’ vs ‘Sell’ in the first table. This means the strategy exit should have hit the exit during the day and the position sold.
Questions? Email us.