A Professional Quant Based Portfolio Trading Strategy
Weathervane is a profitable market insight strategy that will change every investment decision you make. It uses the bond market to decide between trading equities, trading bonds or being in cash.
Testing period is from January 1, 2007 to September 30, 2026 and metrics are updated after the end of each quarter.
Live trading signals have been published on the site since August 2026
Portfolio 1 – SPY/TLT
The portfolio can be in either SPY or TLT or cash. There is a 5% maximum loss stop and a 7.5% trailing stop loss.
Portfolio Statistics
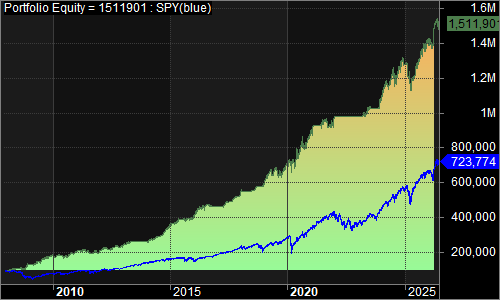
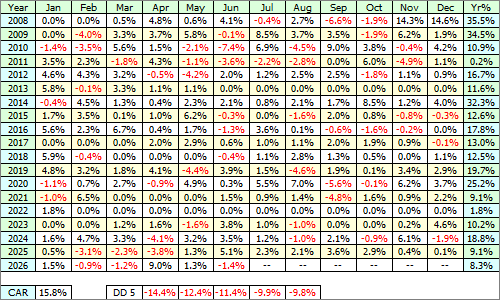
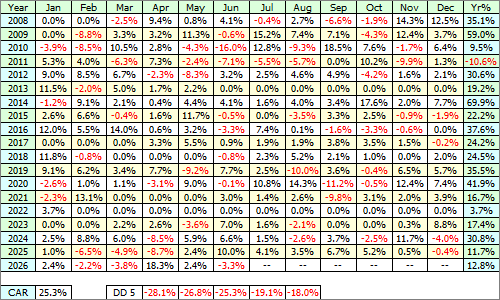
15.6% Compounded Annual Returns
60.6% Exposure
1.36 Sharpe Ratio
Top three drawdowns(-14.3, -12.4, -11.4)
-7.8% Worst 3 month return
0.0% Worst 12 month return
+28.31% Best 3 month return
+74.63% Best 12 month return
0.48 correlation with the S&P500 index
Trades Statistics
188 Trades with 63.8% winners
3.1% Average % profit on winning trades
-1.3% Average % loss on losing trades
-7.8% Worst trade
28.9% Best trade
19 Average trading days held
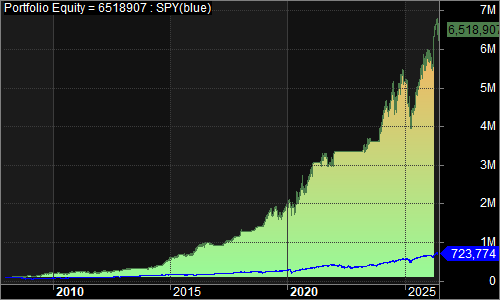
Equity Curve since 2008
Monthly Returns
I have over a decade of quant trading experience and am the Chief Investment Officer for a quant-based advisory firm. I’ve known Cesar for 8 years and he is my first and foremost “go-to” resource for financial markets research, quantified strategy development, and coding. Unlike some theoretical “quants,” Cesar is also a trader. He understands the markets and the real-world limitations of broker order offerings, liquidity, and order placement. Rob Davenport, LCA Capital, LLC
Portfolio 2 – QQQ/TLT
The portfolio can be in either QQQ, TLT or cash. There is a 5% maximum loss stop and a 7.5% trailing stop loss.
Portfolio Statistics
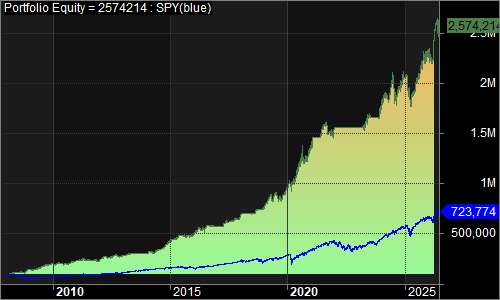
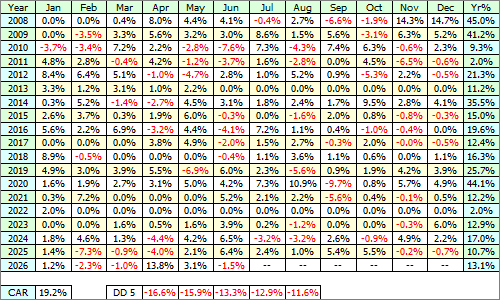
18.6% Compounded Annual Returns
60.2% Exposure
1.36 Sharpe Ratio
Top three drawdowns(-16.6, -15.9, -13.3)
-11.0% Worst 3 month return
-14.3% Worst 12 month return
+22.31% Best 3 month return
+65.68% Best 12 month return
0.47 correlation with the S&P500 index
Trades Statistics
193 Trades with 63.7% winners
3.8% Average % profit on winning trades
-1.8% Average % loss on losing trades
-16.2% Worst trade
28.9% Best trade
19 Average trading days held
Equity Curve since 2008
Monthly Returns
There’s no way I’d be professionally managing money today were it not for the professional advice and help of Cesar Alvarez. I’ve yet to meet a trader/researcher with such a superb understanding of the markets; as well as the dangerous trapdoors that await if you decide to develop your own quant system. Mark Angil, Architect of Midway II, 1st Place Winner of BattleFin’s Sharpe Ratio Shootout International Quant Finance Tournament 4.0 (Pro Division)
Portfolio 3 – SSO/UBT
The portfolio can be in either SSO, UBT or cash. There is a 10% maximum loss stop and a 15% trailing stop loss. Before UBT starts trading in February 2010, TLT is used for the signals.
Portfolio Statistics
24.9% Compounded Annual Returns
60.6% Exposure
1.23 Sharpe Ratio
Top three drawdowns(-28.1, -26.8, -25.3)
-18.8% Worst 3 month return
-10.6% Worst 12 month return
+27.35% Best 3 month return
+71.82% Best 12 month return
0.53 correlation with the S&P500 index
Trades Statistics
188 Trades with 62.8% winners
5.7% Average % profit on winning trades
-2.8% Average % loss on losing trades
-15.3% Worst trade
56.4% Best trade
18 Average trading days held
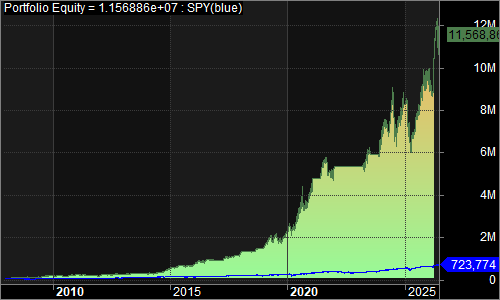
Equity Curve since 2008
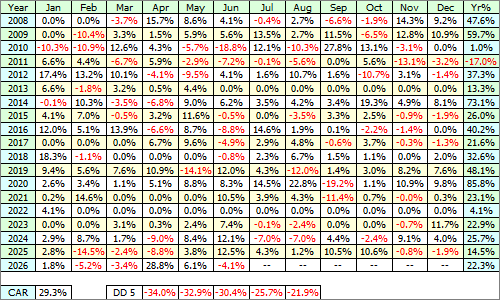
Monthly Returns
I have been corresponding with Cesar and following his work for several years. His research is first rate and his reports are clear and unambiguous. He is an expert trading system developer and programmer. Most importantly, he has discovered profitable and persistent patterns, and developed profitable and practical trading systems around them. Dr. Howard Bandy Recognized Quant Author
Portfolio 4 – QLD/UBT
The portfolio can be in either QLD, UBT or cash. There is a 10% maximum loss stop and a 15% trailing stop loss. Before UBT starts trading in February 2010, TLT is used for the signals.
The portfolio can be in either UPRO, UBT or cash. For UPRO, there is a 15% maximum loss stop and a 22.5% trailing stop loss. For UBT, is a 10% maximum loss stop and a 15% trailing stop loss. Before UPRO starts trading in June 2009, SSO is used for the signals. Before UBT starts trading in February 2010, TLT is used for the signals.
Portfolio Statistics
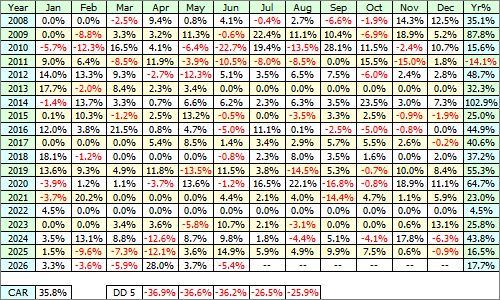
35.1% Compounded Annual Returns
60.6% Exposure
1.24 Sharpe Ratio
Top three drawdowns(-36.9, -36.6, -36.2)
-26.4% Worst 3 month return
-14.1% Worst 12 month return
+34.50% Best 3 month return
+61.107% Best 12 month return
0.56 correlation with the S&P500 index
Trades Statistics
189 Trades with 63.0% winners
8.1% Average % profit on winning trades
-4.0% Average % loss on losing trades
-7.2% Worst trade
92.0% Best trade
22 Average trading days held
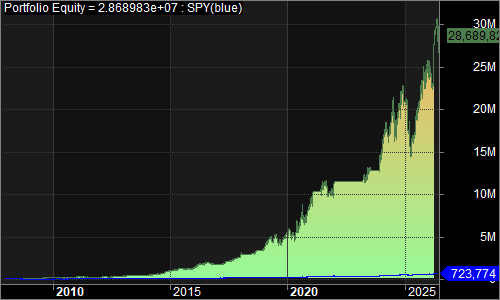
Equity Curve since 2008
Monthly Returns
Start your free one week trial
During your trial you will have access to all previous trades and commentary. Cesar or Steve are available to answer your questions.
Cesar is well known in the quant community from his trading blog, Alvarez Quant Trading, where he shares his trading insights and research. He also consults with traders to test their trading ideas and help them improve their current strategies. From 2004 to 2013, Cesar was the Director of Trading Strategies at TradingMarkets.com and Connors Research. Cesar has also developed many strategies for private equity funds, is the author of multiple books on trading, and — in a former life — was a Software Engineer on the early versions of Microsoft Excel. After so many years developing well over 100 different methodologies, Cesar, like many true masters of his profession, has come back to the point of ultimate simplicity and efficiency as the best sustainable approach to active trading.
Steven Gabriel
Steven has an extensive history trading equities, options, futures, and volatility. For the past 13 years he has been a quant-based trader, working alongside Cesar on research for 100’s of different ideas, concepts, strategies, and systems. Steve is also an Emergency Room physician. But he only practices medicine half-time now, because his success in trading financial markets.