
- in TechTorque by Cesar
Tech Torque – Signal Table Explanation
These are explanations to each section of the signals page. If something does not make sense, either email us or add a comment below.
Signals Table
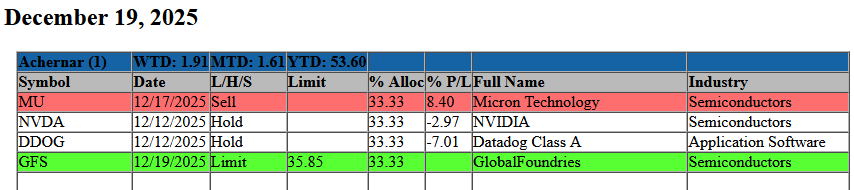
Date Line: The date the signals are for
Top Blue Line: The name of the portfolio. The number in parentheses is the portfolio number.
WTD: The current week’s return. This includes open and closed positions.
MTD: The current month-to-date return of the portfolio. This includes open and closed positions.
YTD: The current -year-to-date return of the portfolio. This includes open and closed positions.
The MTD and YTD returns may not match results derived from the signals in the tables. MTD and YTD are calculated by running a backtest on the current historical data. This data may have changed slightly due to price corrections, dividends and other reasons.
The trade portion of the table contains the current positions for the portfolio.
Symbol: The ticker symbol of the stock
Date: The entry date of the trade
L/H/S: Tells if the stock is a LIMIT (green) or HOLD or SELL (red). For LIMIT, you place a buy limit at this price for day only (not GTC). For example, for GFS, you would place a buy limit order good for the day at 35.85.
Limit: If LIMIT, then this is the price to place a buy limit at. If HOLD or SELL, this will be blank.
% Alloc: The percentage of the portfolio to allocate to this position
% P/L: The percent profit or loss of the position as of the most recent close
Full Name: The full name of the stock
Industry: The industry the stock belongs to
Questions? Email us.